Fundraising Solutions for Schools, Teams, and Organizations
Fundraising Solutions for Schools and Teams
Perfect for Schools, Teams, Organizations, Bands, Boosters, 4-H Groups, Churches, and more!
Trusted Nationwide & Locally
Schools & PTOs
PTOs and administrators trust uScore to provide high-need, everyday items. Our programs are designed for consistent, repeatable success year after year, making delivery day the easiest part of your calendar.

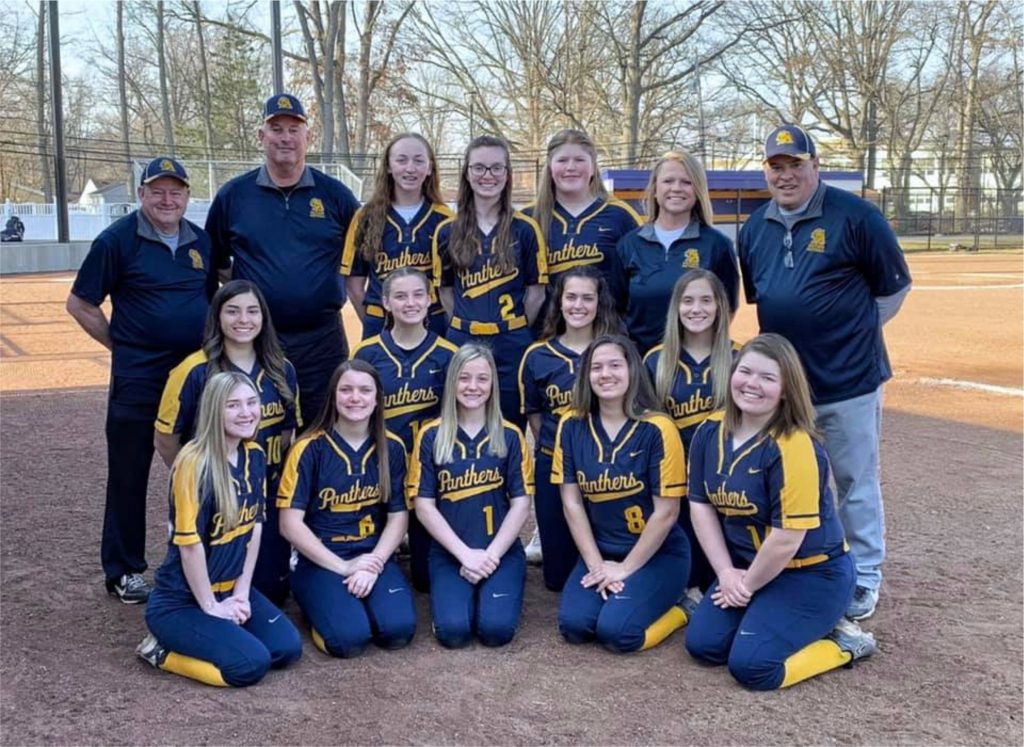
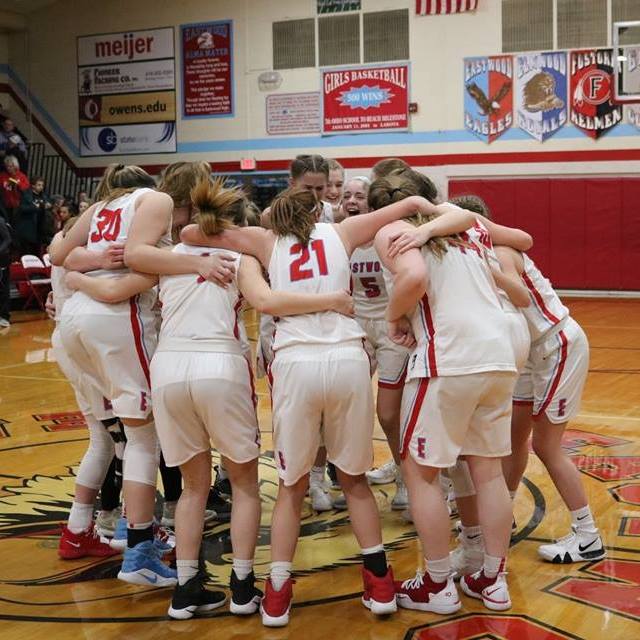
Teams & Boosters
From baseball to cheer, we help teams cover uniforms and travel costs quickly. By selling practical products your community already buys, you hit your goals without the “fundraising fatigue.”
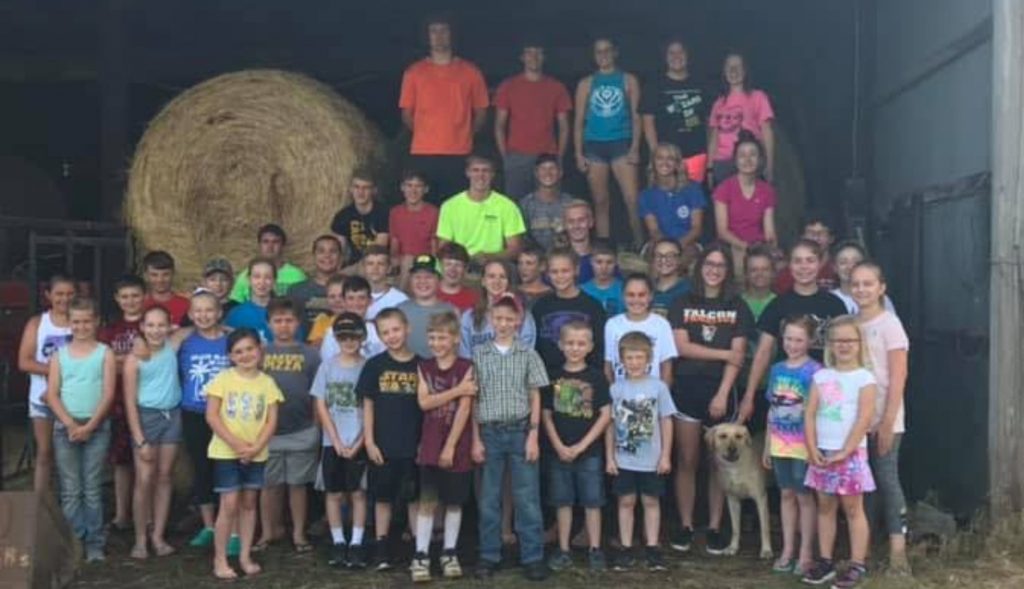
Clubs & 4-H Groups
Band, theater, robotics, and 4-H groups find our simplified approach perfect for their busy schedules. We provide the tools you need to reach your goals while offering value to your supporters.
Ready to Get Started?
Let’s recommend the best program for your group size and location.